Is Double Bottoms Pattern Bullish or Bearish?
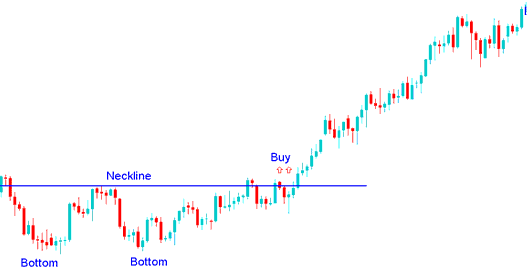
Example of Double Bottoms Bitcoin Chart Pattern
Double Bottoms Bitcoin Chart Pattern is a Bullish Cryptocurrency Pattern - Double Bottoms Pattern is a Bullish Bitcoin Trading Signal Pattern
Summary:
- Double bottom cryptocurrency chart pattern forms after an extended move downwards bitcoin trading downward trend
- This Double bottom cryptocurrency pattern formation indicates that there will be a reversal in btcusd trading market
- We buy when bitcoin trading price breaks-out above neckline: as described on the cryptocurrency trading example illustrated below.
What Happens to Crypto Price Action After a Double Bottoms Crypto Chart Pattern in Crypto Trading?
The double bottom cryptocurrency chart pattern look like a W Shape cryptocurrency chart pattern, the best reversal btcusd signal is where second bottom is higher than the first bottom as illustrated and shown below.
This means that the reversal cryptocurrency signal from the double bottoms cryptocurrency chart pattern can be confirmed by drawing an upwards bitcoin trend line as shown below. If a trader opens a buy cryptocurrency signal the stop loss will be placed just below this upward bitcoin trend line.
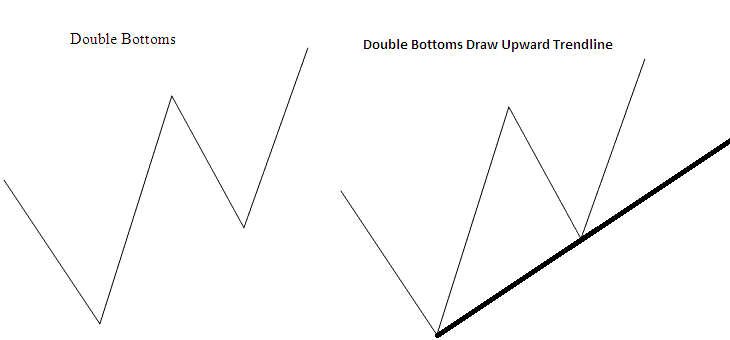
Analysis of Double Bottoms Crypto Pattern - Example of Double Bottoms Crypto Chart Pattern


